
Today’s marketing efforts must account for profitability. At the end of the day we need to make sure a customer’s value exceeds what we are spending to acquire that customer, which means - queue music from heaven - profitability.
In the realm of paid acquisition marketing, PPC marketers are becoming more and more savvy about proving the return on investment of their marketing. The easiest and most typical approach to proving profitability factors in the following:
- Cost of goods
- Media spend
- Agency fees
This approach, however, misses one vital piece of information that can dramatically change your perception of marketing: the lifetime value of your customer. What exactly does that mean? In short, the lifetime value of a customer is the revenue a customer is worth to you throughout their lifetime. For businesses that have customers who purchase multiple products throughout a year, this value is extremely important to determine.

In the following tutorial, I will walk you through the steps you can implement to identify and factor the lifetime value of your customers. If you don't have access to previous year's data, this same process can be used to determine the value of a customer over a year - which is still extremely valuable for your marketing. Ok - let's get to it! Here’s the simple process to determine the lifetime value of your customers:
Step 1: Pull an Orders Report.
Most companies have a customer database that includes a transaction history. If your business is e-commerce, accessing this information is as easy as logging into your e-comm platform & exporting an “Orders” report. Regardless of your platform, you’ll be looking for a report that includes the following:
- Customer Name
- Order Number
- Purchase Date
- Total Revenue
Step 2: Use Excel to Determine Customer Value.
Once you have the above report open in excel, create two identical data sets. Simply copy the entire data set & paste it a few rows below the original data set. You can name the sets: dataset1 & dataset2. Now, perform the following actions:
- Delete all columns in dataset2 (the pasted data set) except for name.
- Using the duplicate remover tool, remove all duplicate names so you have a list of unique customers. Tip: I recommend using email addresses, if available, as customer names may have been input incongruously during different orders. It’s important to note that if someone is checking out as a “guest”, email addresses are typically not required; if this is the case - use name.
- From this data set, you can determine your total number of unique customers. If you have a lot of customers, use the [=counta] formula to tally your unique customers.
- Once you have tallied your total number of unique customers, you’ll use the [=sum] formula in dataset1 to return total revenue.
- Divide [total revenue] by [unique customers] and this is your customer value for whatever timeframe your report was pulled. Ex: If it is a 10-month report that number is your 10-month customer value.
This is the amount that you can spend to profitably acquire a customer.
Step 3: Dig Deeper to Define the Value of Return Customers.
Now is the time to dive into customer buying patterns. Let’s pick up where we left off in excel to determine the value of return customers.
- In dataset 2, use a [=countif] formula in the column to the right of customer names to “look reference” dataset1 - the criteria being the customer name and the return value column being the number of times their name appears in dataset1. This will give you the total number of purchases those customers made in the specific timeframe.
- Still in dataset2 use a [=sumif] formula to reference dataset1 and return the total revenue generated from each unique customer.
- Sort dataset2 (including order count & revenue) by order count. Remove all single purchases (you may want to move them to another tab to reference later).
- Total revenue from [return visitors] and divide by the number of [unique return purchasers]. Presto – you now have the value of a return customer.
Step 4: Determine the Average Transaction Value of a Return Customer.
Often we find that return customers are worth the effort to acquire and analyze because they’re more likely to spend more per transaction. These are your frequent & loyal shoppers.
- In dataset2, use the [=sum] formula to find the total number of orders from return purchasers. Divide total return purchaser revenue by this number & you have your average transaction value for return purchasers. Tip: to get more granular, you can break this out by average transaction value of a customer purchasing 2x, 3x, 4x, 5x etc.
Step 5: Find the Percentage of Customers that Become Return Purchasers.
A final step to building out your lifetime customer value model is to provide insight into the average rate that customers become repeat buyers.
- Using dataset2, use [=counta] formula to determine number of unique return purchasers.
- Divide this number by your total unique customers to find the percentage of your customers that become return purchasers.
- Complete these analyses annually to document changes in your customer “lifetime” value.
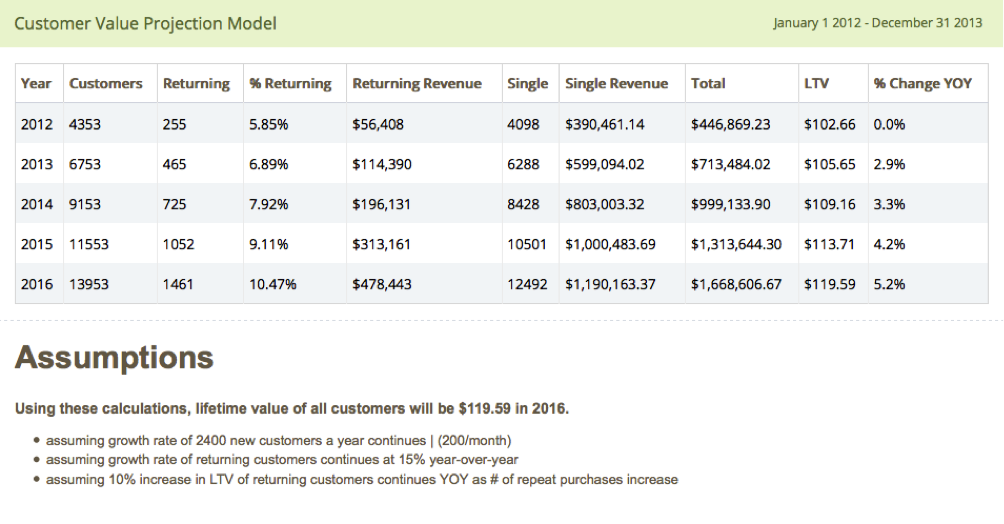
Using these findings, you can also build a projection model to calculate how your customer lifetime value will likely increase over time. Here’s an example of what this might look like:
Congrats! You’ve just defined the lifetime value of your customers.
By identifying and factoring the lifetime value of your customers, you will more accurately understand the value of your marketing dollars on your bottom line. Even if you begin with a 12-month or 24-month value, this is extremely valuable information to show a customer’s value beyond their initial purchase.